First and foremost, I was overjoyed to accept the travel and lodging grant, and attending the conference was a memorable experience. My decision to attend the Inaugural State Of The Map Conference Nigeria 2022 was motivated by a desire to learn new and improved methods for acquiring, managing, interpreting, and analyzing geographic information. As a student studying Geoinformatics and Surveying, I have frequently sorted out strategies that could reduce the occurrence of natural disaster in the country. The search however made me become a volunteer with UniqueMappers Team (UMT) which is under Humanitarian OpenStreetMap Team (HOT). Since joining this community, I have actively been involved in disaster responses in Nigeria in regards to oil spillage, flooding, terrorism, crimes, diseases outbreak. From the conference I was equipped with both the skill to ethically understand geoinformatics and surveying theories and practices, and also with the understanding of advance skills used by modern geoinformatics and surveying practitioners. I also learnt new innovative techniques that could reduce the occurrence of natural disaster, oil spillage, terrorism, crimes, diseases outbreak in the country. I also use the opportunity to interact with great minds from different part of the globe. I volunteered to serve in the in technical department during the conference. I must thank HOT worldwide and the Unique Mappers team for their honest efforts in providing a travel grant for me to attend the SotM conference. My appreciation also extends to the national coordinator, Mr. Victor Sunday, for directing, supervising, and chairing this excellent project Thanks for hosting this year’s SotM conference 2022. Thank you very much Ifeanacho, Daniel Odife GIS Analyst and Tech +2348089322102 Email: ifeanachoodife2@gmail.com
Diary Entries in English
Recent diary entries
Attending the inaugural SotM Nigeria was a memorable experience, From the beginning of the trip (South Eastern Nigeria) which took about 6 hours journey to the conference venue (Port Harcourt) was incredible and successful. The conference gathered people around the globe to explore and share their mind blowing topics, exhibition, research work and experience around OSM, GIS, open data, humanitarian and disaster response at the first ever SotM conference in Nigeria, I was opportune to be part of selected presenters. I shared a paper on the “GEOSPATIAL MAPPING AND ANALYSIS OF HEALTHCARE FACILITIES IN NSUKKA URBAN USING GIS TECHNIQUES”. The conference hosted over 150 virtual participants and over 40 onsite participants who came to share their divers’ experiences on GIS, OSM, Humanitarian response and disaster mapping etc. The conference gave me the opportunity to meet, connect, collaborate and network with participants from U.S, London, Hong Kong, Tanzania, Zimbabwe, Lagos, Oyo, Enugu, Port Harcourt and other part of the world, and it exposes me to different application of OSM data and tools that will enhance my research works. indeed, it was another adventure and opportunity for me. I must appreciate the sincere work of HOT global, HOT unsummit, WNH, LOC members and the Unique Mappers team for offering a travel grant to attend the SotM conference. My gratitude also goes to the national coordinator Mr. Victor Sunday for Leading, guiding, and chairing this awesome work and to the LOC port Harcourt team you guys are wonderful.
Thanks for hosting this year’s SotM conference 2022. Thank you very much Akor, Daniel Enechojo GIS Analyst and Tech +2348141954990 Email: danielakor714@gmail.com
My Introduction
Hi, I am Manish Adhikari from NEPAL.I am taking undergraduate degree in Geomatics Engineering from Tribhuvan University, Pashchimanchal Campus, Pokhara.I am a youthmapper and mapping volunteer at youthmapper’s chapter GESAN(Geomatics Engineering Students’ Association of Nepal).Currently, I am a HOT Data Quality Intern.I am here to express my 250 days mapping experience and the journey upto now.
Beginning Of The Journey
My OSM journey started from 21st May ,2019.I know about OSM and YouthMappers from the day when we got chance to attend Basic OSM Training conducted by Geomatics Engineering Students’ Association of Nepal.I learned about mapping,id editor,JOSM,adding point ,line and polygon.I was so excited to learn this and started contributing to OSM day by day.
Experience Throughout 250 Days
At the very beginning,I was happy to include my house and its surroundings in the map.Slowly, I started mapping different unmapped parts of my nation.I was motivated day by day in the mapping field because of my related academic field and impression from my senior Anil Basnet,top contributor of OSM from Nepal.I used to participate in different mapathons organized by GESAN.Improving day by day,I was able to become an intermediate mapper from beginner level. There are different projects to which I contributed.I never want to miss any chance to involve in such mapping projects as I had to learn many new things and skills on mapping and improve myself.On this journey , I have recently got a great opportunity as a Data Quality Intern at HOT.I have learned many new ideas on mapping and validation.I got to know the importance of quality mapping and quality data.Accordingly, I have made myself to perform quality mapping and validation with the use of different data quality tools. Here are some of the projects that I have contributed to the date.
Last November 21 to 25, 2022 we attended Pista ng Mapa and State of the Map Asia 2022 Conference at the Bicol University East Campus in Legazpi City, Albay. It is an open conference about mapping and the importance of using open-source data.
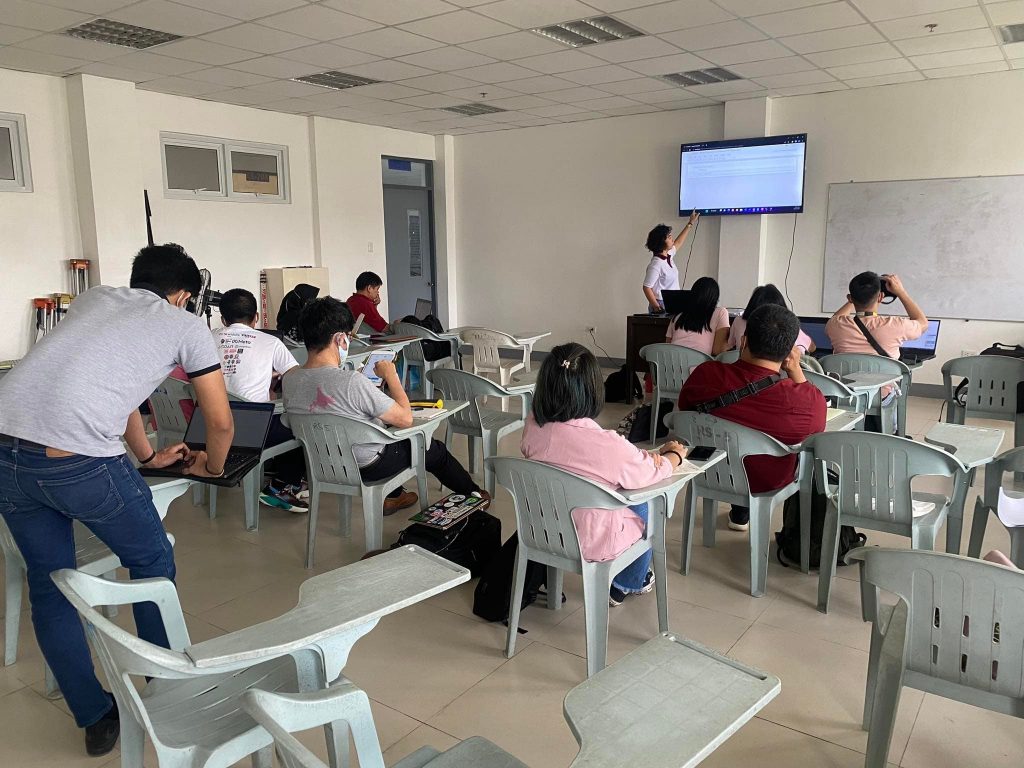
A workshop was facilitated by me and Dianne Bencito about using Geospatial data with Python programming. We introduced the basics of python and GIS and gave hands-on activities. I guided and gave materials to the participants to make sure that they are keeping up with the discussion. This workshop helped me to improve speaking in public and properly interact with people confidently.

During the last days, I attempted to document 3D features of some notable buildings from my region, mostly churches and castles.
Simple 3D Buildings and tagging consensus
Discovering what is the most used tagging scheme was a little bit confusing. At first glance, the OSM-4D roof table seemed to be promising as it offered some very useful tags for churches such as roof:shape=apse_gabled. Unfortunatly, after researching the topic, it appears that OSM-4D isn’t really supported at the moment. Consequently, I had to resort to simple 3D building.
Limitations
Apses and cone roofs
The simple 3D buildings however, while being “the best currently widely supported”, is quite limited. After asking how members of the community would tag apse_gabled and cone roofs, I resorted to divide the half domes of the apsed roofs into multiple small triangles with skillion roofs and document their direction angle. F4map seems so be able to render it in a satisfactory way at times and in some cases in a rather disappointing way. The roof:shape=pyramid was used instead of the cone tag. It seems to be understood by renderers. Of course, while one shouldn’t tag for the renderer, the feed-back of the renderers are useful to identify tagging mistakes.
Besides the cones and apses, having the possibility to tag roofs hipped on one side only would be quite convenient.
Equal min_height and height to create overhang roofs
In order to describe overhang roofs, I resorted to create a “building” with a min_height = to its height and then tag the roof. This element for instance was tagged this way:
| building:part | yes |
| description | part 3 of the bell tower of the Epallinge church |
| height | 12.75 |
| min_height | 12.75 |
| roof:direction | 118.64 |
| roof:height | 5.95 |
| roof:material | tile |
| roof:shape | skillion |
(or, what’s wrong with the general purpose map on my phone that just seems designed just to show me adverts?)
I decided to write this after reading some of the comments on the wiki here and in the community forum here.
People tend to view “things that appear on a map” as “somewhere that they can go”. For example here:
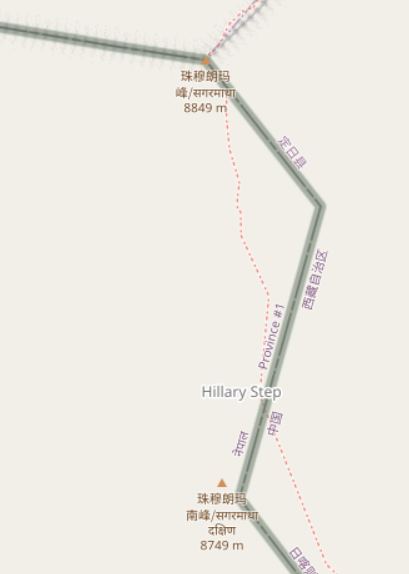
someone who didn’t do their research properly might think that they can just wander along that path to the top of Everest from the south, despite the underlying data suggesting “difficult alpine hiking”. This diary entry is an attempt to try and avoid such misunderstandings.
What options does a map have to different things?
The map at map.atownsend.org.uk shows linear paths and tracks as a single line, It shows legal rights of way (some special categories in England and Wales) and also tries to give some indication of what a walker might expect on that path.
History
I’ve been contributing to OSM for years now in the faith that the use cases for open geospatial data will grow over time. I’m proud of how complete my local area is, and slightly embarrassed at the thought of others seeing how many nodes and ways have my username against their history! I’m aware that OSM data is appearing in more places to the point that every time I see a map or some detailed analysis of a local area, I’m looking for the OSM reference. This has included in the past couple of years:
- Path surface and quality stats from Strava of recommended bike routes
- The live map on a British Airways flight I was on.
- a train route map
I also think the potential for customised renderings of maps is amazing, including some of my favourites:
- Cyclosm
- The OpenStreetMap Transport Map layer
- OpenRailwayMap, particularly the maximum speed rendering, which is nice for visualising the available routes to long distance destinations
Contributing is a never ending task though. It can vary from the high-level detail like landuse to the intricate detail like business opening times and whether a location is completely wheelchair accessible. Plus aerial imagery gets better over time, meaning there’s always scope for revisiting stuff you’ve already mapped to improve it. I’ve always been curious how the data could be reused, (and the WeeklyOSM newsletter is a great place to find new examples) and have started looking at online tutorials for QGIS. I’ve not done any formal training in GIS though.
Ideas
I’m quite interested in the use of sub/urban space, and so a couple of ideas I’d like to try include:
- calculating the length of protected/unprotected cycle lanes within a polygon (eg a London borough) as an absolute value and as a proportion of total road network
- calculating the amount of green space within a polygon (eg within a set of council wards) as an absolute value and proportion of total space

Introduction to myself
My name is Narayan Thapa, and I studied geomatics engineering at Kathmandu University. I’m particularly interested in using OpenStreetMap, UAVs, GIS, Python programming, and cloud computing (Google Earth Engine). In the project “Mapping Banepa Municipality in OSM and its Applications in Mitigating Effects of Urbanization- A Case Study of Urban Rooftop Farming Using Geospatial Technology,” I served as the project lead. I currently work at ICIMOD as an intern.
Introduction to project
This project seeks to address global issues like “zero hunger” (agenda 2), “good health and well-being” (agenda 3), “sustainable cities and communities” (agenda 11), and “climate action” (agenda 13) by creating a bridge between geospatial technology and society. In Nepal, many municipalities are expanding quickly. Agricultural lands have been transformed into structures and infrastructure as a result of rapid urbanization. The urban environment has been negatively impacted by this, as local food production and greenery have declined. Urban areas people were primarily dying for food during the COVID-19 situation, as opposed to from disease. By mapping the current state of rooftop farming in Banepa Municipality and estimating the area for future farming, we hope to find a solution to this issue.
The idea behind the project

Dear OpenStreetMap Community, fellow mappers
It is my pleasure to present the annual report of the OpenStreetMap Foundation for the year 2022.
First and foremost, we have been thrilled to welcome Grant, our first employee. He has joined the OpenStreetMap Foundation as our senior SRE after many years of volunteering on the Operations Working Group, and we believe that his expertise and experience is a valuable asset to the OpenStreetMap Foundation. We now finally have someone with the both the time and experience to tackle the big infrastructure projects that will lead us to increased resiliency and stability.
If you would like to learn more about Grant and his work, you can listen to an interview with him on the geomob podcast.
The growth of the OpenStreetMap project isn’t slowing down. We recently passed 8 billion nodes, 900 million ways and 10 million relations. We will reach 10 million registered users in 2023.
As the OpenStreetMap project continues to grow, the workload for the Foundation’s volunteer board members has also increased. While we are thrilled to see the project’s success, it is important to acknowledge that this growth also comes with its challenges. In particular, the increased workload can be overwhelming at times, and it is not always easy or fun. This year has, counterintuively, been marked by a relative lack of activity from the Foundation’s board members. While this is not new or unique to the OpenStreetMap Foundation, several of our board members have experienced burnout and have taken a step back from their roles. The burden of board work can be heavy - you join because you think maps are fun, and you end up spending your free time knee-deep in finance, HR and legal matters.
I recently watched a Jay Foreman video on why many maps have trap features. Features such as. Mispelled Names Non Existent Things Making something more bendy. They are done purpose, rather than people copying off OSM without attribution. They can copy OSM but it has errors on its map. But only minor changes so OSM can catch those without an attribution out or a service like Google Maps using OSM data without an attribution or credit.
The new “Footways” category (under Transportation -> Walking) shows sidewalks, footways, steps, platforms and pedestrian zones. Sidewalks mapped on the street way (sidewalk:left, sidewalk:right resp. sidewalk:both) will be shown with an offset - hatching indicates the relation.
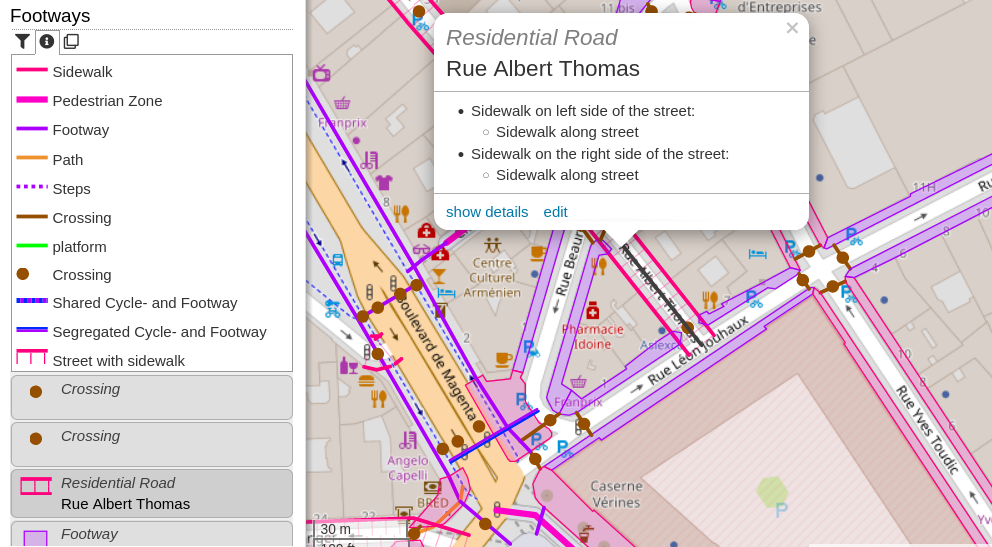
If you have an questions, comments or ideas, please create an issue on Github! Quite some new strings were added to the translation system. Your participation is highly appreciated!
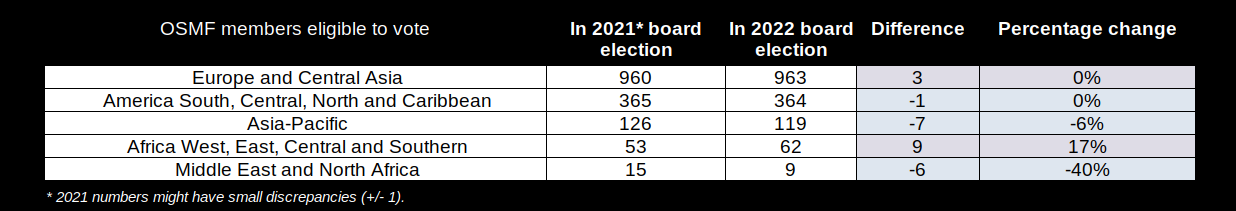
As I’m involved in running the OSM Foundation board elections, I thought it would be interesting to share some statistics on the OSMF members who are eligible to vote this year, compared to last year.
Thanks and data sources
Thanks to:
-
the volunteers of the Membership Working Group for looking after the database with the OSMF memberships and
-
to Pascal Neis, for publishing OSM related statistics, e.g. average number of OSM mappers (mapping accounts active) per day and per country.
Regions of OSMF members eligible to vote
This year 1518 out of 1937 OSMF members (as of 2022-12-07), from 96 countries, are eligible to vote in the 2022 board election. The regional distribution is shown on the image below and the table is also on the OSM wiki.
Notes:

Update: Check out my comment below about the state of the art being greatly improved!
The idea
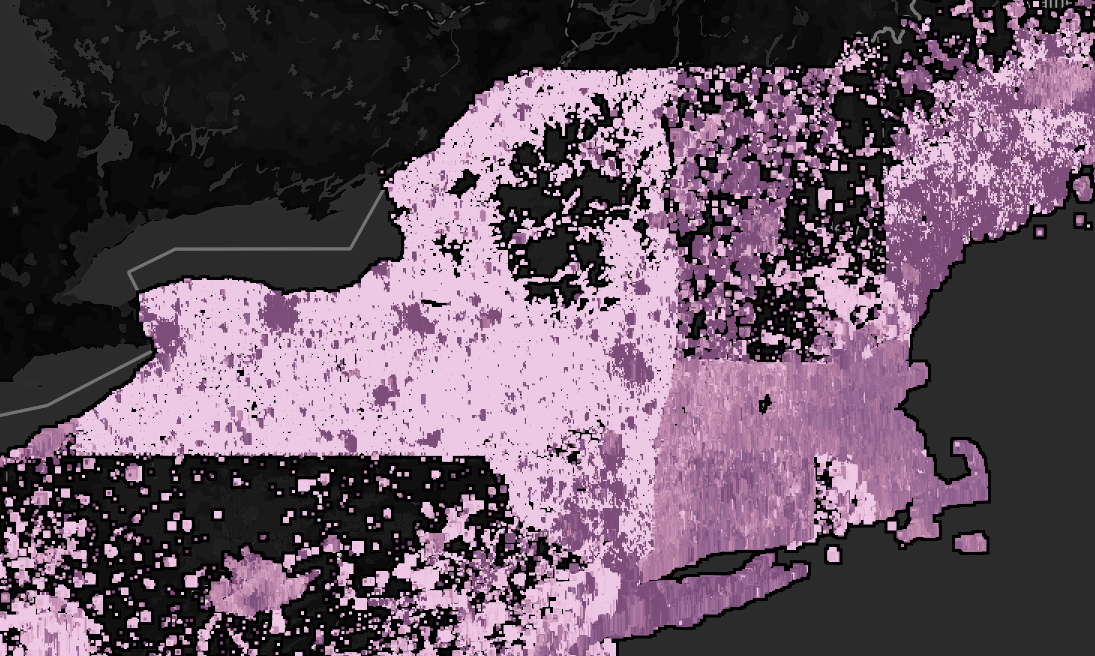
After finishing my first address import I was looking for a good view of “where else needs addresses”. One trick that always pays dividends for me is to look at distributions of ratios of various quantities. In particular, I presumed there should be a pretty smooth distribution to the ratio of number of addresses vs number of buildings in any given area.
Building it
- Get the data from Geofabrik state data dumps (US regions are too big for the tools)
- Use osmconvert to flatten out ways and relations. Something like:
osmconvert alabama-latest.osm.pbf -o=alabama-nodes.csv --max-objects=50000000 --all-to-nodes --csv="@lat @lon addr:housenumber building"- A bit of C# to do the binning (I’m sure QGIS and other tools are great for this but you use what you know)
- Tableau Public for the viz generation
The results
Many of the features we had to deal with in the Sq___ renaming were small streams and creeks. For some reason, Sq___ Creek seemed to be a very popular name. In most cases, the creeks weren’t present on OSM, and as part of the renaming, we decided to add missing features with the new names so that future mappers wouldn’t unknowingly add the features with the old Sq___ names. So, we had to map a lot of small creeks.
One of the challenges with mapping named waterways is identifying the full extent of the waterway. Where is the mouth of the waterway? Where is the source? Of the many branches upstream from the mouth, which branch is the identified course?
If you’re just working with GNIS, the GNIS data has two or sometimes three sets of coordinates for waterway features. The first coordinate is the mouth. If there is a second coordinate, it falls somewhere in the middle of the waterway. The last coordinate is the source.
From there, you can use topo and aerial maps to trace the course of the waterway by hand.
Alternatively, you can download the local data file from the National Hydrography Dataset, find the waterway you want, merge it into an OSM layer, and clean it up before uploading it. Here’s how that works:
The celebrations have been over for more than a week, yet the Pista ng Mapa X State of the Map Asia 2022 spirit still abound!
The first international conference I attended just happened so fast. I still remember the time that I was accepted as one of the local travel grantee of this international conference in Albay, Legazpi. One thing that came into my mind for attending the conference is that I will be seeing the beauty of great Mt. Mayon but I was wrong, It was the experiences and learnings that will be my souvenir once I got home.

I had been part of the Viscan YouthMappers Organization in Visayas State University in Baybay City, Leyte, Philippines. Since I joined the organization months ago, I started contributing in Open Street Map to map places that needed help on disaster response and planning on a certain area. Through this conference, I was able to share my hardwork and perseverance to other people I just met.
I understand that for most members of this community this is offensively primitive, but I have spent an hour ploughing through all APIs, so until https://github.com/mocnik-science/osm-python-tools/issues/70 is fixed perhaps it helps somebody:
# From URL (e.g., "https://www.openstreetmap.org/way/30722274#map=14/49.2925/38.1815")
# to geo-URI of the center of the object: geo:49.2953098,38.1827257

import os.path
import sys
import urllib.parse
from OSMPythonTools.cachingStrategy import CachingStrategy, JSON
from OSMPythonTools.api import Api
from shapely.geometry import shape

CachingStrategy.use(JSON, cacheDir=os.path.expanduser("~/.cache/osm"))

api = Api()

parsed_url = urllib.parse.urlparse(sys.argv[1])
way = api.query(parsed_url.path)
geom = shape(way.geometry())
print(f"geo:{geom.centroid.y:.7f},{geom.centroid.x:.7f}")
Complete program is now hosted at https://sr.ht/~mcepl/osm_where/
OSM beginner!!!!
Driving around Dyfi Valley and on the A470 testing Actia (UK)’s Intelligent Speed Assistance application I have noticed a few inconsistencies in the location of speed limits.
Insert Wikidata into POI in OsmAnd
Inserir Wikidata em POI no OsmAnd
Brief tutorial on how to insert Wiki (Wikipedia/Wikidata) into Points of Interest (POI) in OsmAnd application with OpenStreetMap map. By Túllio M. Franca - UMBRAOSM
Breve tutorial de como inserir Wiki (Wikipédia/Wikidata) em Pontos de Interesse (POI) no aplicativo OsmAnd com mapa OpenStreetMap. Por Túllio M. Franca - UMBRAOSM
https://pt.slideshare.net/umbraosm/inserir-wikidata-em-poi-no-osmand-254777845
Tulio França https://www.instagram.com/ondecetaa/
UMBRAOSM - União dos Mapeadores Brasileiros do Openstreetmap www.umbraosm.com.br